The Property Institute (TPI) is pleased to announce the publication of its Service Charge Index 2026 report. Based on contributions from thirteen TPI member firms, the report draws on data from 2,137 residential estates covering more than 117,000 homes, presenting data on residential service charge trends across England, Scotland and Wales.
About the Report
It provides insight into service charge trends between 2024 and 2026, including analysis by building height and age, helping to build a clearer understanding of the factors influencing residential management costs across different types of buildings and developments.
The Index was developed using data submitted by 13 TPI member firms, who contributed either manually or through TPI Service Charge Index platform, powered by Ark Residential.
The sample is predominantly made up of leasehold flats, which account for 95% of homes included within the report.
Key Highlights
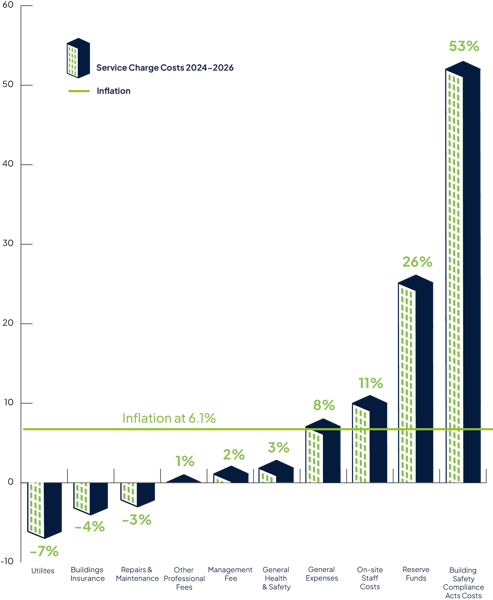
- Over the full two-year period, average service charges increased by 5.8%, slightly below cumulative inflation of 6.1% over the same timeframe.
- The average service charge per leaseholder in 2026 (budget) is £2,880.
- Service charges vary widely across the market, ranging from an average of £1,525 in the lowest 10% of buildings to £8,680 in the highest 10%.
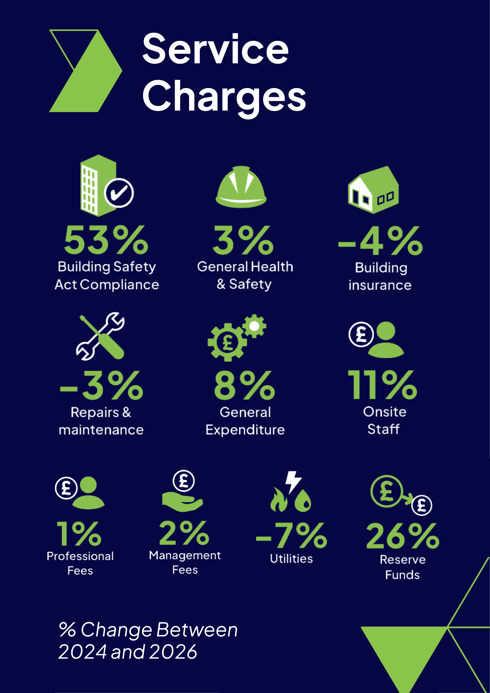
- The Building Safety Act Compliance costs recorded the highest year-on-year growth from 2024 with 53%, followed by Reserve Funds with 26%.
- Building height has a clear impact on costs, with average budgeted service charges at £2,418 for buildings under 11m, £3,507 for buildings between 11–18m, and £4,447 for buildings over 18m.
- Age also plays a key role. Buildings under 25 years old average £2,508 in service charges, compared with£5,208 for buildings over 50 years old. Buildings aged 25–50 years sit slightly lower, at an average of£2,411.
What the Data Shows
The report highlights the continued impact of inflationary pressures, building safety requirements, reserve funds, and insurance costs on residential buildings across the UK.
At the same time, the findings show that service charge increases have, on average, broadly tracked inflation, helping to provide important context around the real costs of managing and maintaining increasingly complex residential buildings.
While the 2024 and 2025 figures reflect final costs incurred by leaseholders, the majority of the 2026 data is based on forward-looking budgets and projections, offering an early indication of the pressures likely to shape residential management costs in the year ahead.
London Report: A closer look at the capital
Alongside the main Index, TPI has produced a dedicated London supplement providing a closer look at service charge trends across the capital.
The supplement draws on the same data collected for the national TPI Service Charge Index 2026, rather than a separate dataset, and provides a more detailed breakdown of what the findings tell us about London. It covers 402 estates and more than 20,000 homes, exploring how service charges have changed between 2024 and 2026 and how trends in the capital compare with the wider national picture.
While overall service charges in London have remained relatively stable, the analysis highlights significant movements within individual cost areas, including buildings insurance, utilities, reserve funds and building safety costs.
Developed with Industry Expertise
This year’s index has been developed through a platform created in partnership with Ark Residential, our technology partner. The collaboration has enabled a more streamlined and efficient approach to delivering the index and supporting its ongoing development.